Trade 2: TRIDENT

 Buy TRIDENT with a STOP OF 7.05


BUY= 7.55

STOP = 7.05

TARGET = 10+
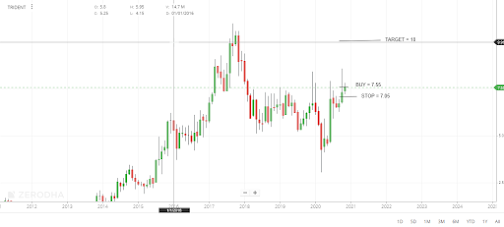

Monthly Chart of TRIDENT

Why trident is a buy?


The price level of around 7 was a strong resistance since 2018.


But the October 2020 momentum has clearly pierced this resistance level.

Now, it looks like the momentum will continue further.

During the coming few weeks/ months time, it can be expected that trident reaches the level of 10+

Comments

Popular posts from this blog

Trade 4: CSBBANK

 Buy CSBBANK with a stop of 220 BUY = 255 STOP = 220 TARGET 1 = 300, TARGET 2 = 330+ Daily Chart of CSBBANK Why CSBBANK is a buy? This stock was trading in the range of 215 to 235 since mid-August, 2020. On November 6, this stock closed at 255. Thereby giving a breakout.  This breakout is backed by a solid consolidation of about 3 months. This stock can be expected to touch a level of 300. At the level of 300, it may further consolidate before moving again upward. Our second target is 330+.

Trade 12: CARERATING

Buy CARERATING Buy = 530 Target = 700 stop loss = 480 1 Day chart of Carerating  Why carerating is a buy? The stock is consolidating for the last 30 days. the price level of around 530 is a critical price zone. once, it breaks the level of 560, the next target maybe 700. overall, based on other parameters, this stock is a good buy with a pre-defined stop of 480.

Trade_2_2024: Bhagyangr

 Stock Ticker = Bhagyangr Buy Range = 100 - 105 Stoploss = will average after confirmation*.  Why I will average instead of SL? - fundamentally good stock - This is in copper sector. Good demand in coming quarters of copper  Chart of Bhagyangr